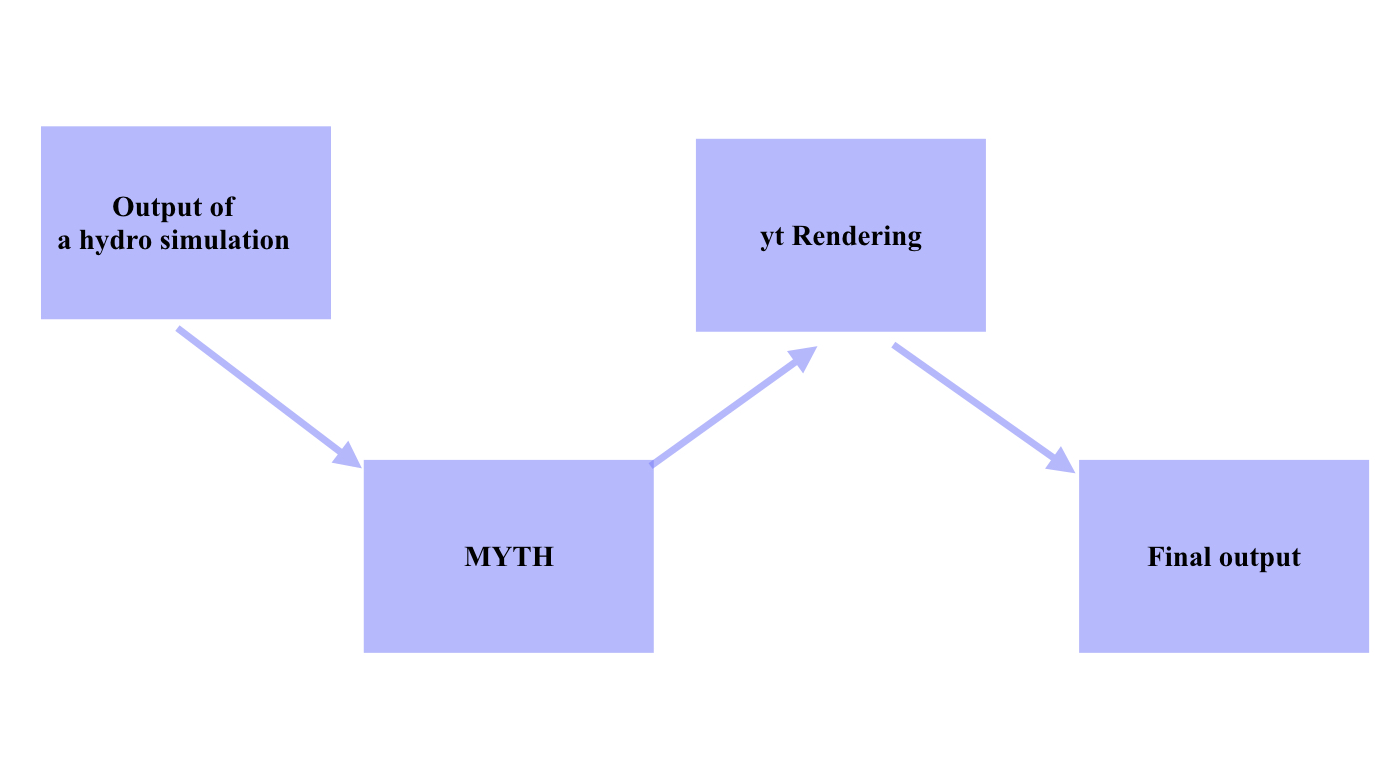
M Y T H
A Multipurpose code compiles YT-rendering for Hydro-simulations

Introduction Methodology Download Developer
3D visualization using MYTH.

M Y T H is a multipurpose YT-rendering code especially designed to compile "yt volume rendering" (https://yt-project.org/).

MYTH currently supports the output of a hydro code PLUTO in dbl format for both uniform and nonuniform grid distributions. We aim to provide supports for other formats in its future release. Design of the MYTH code is such that it can be generalized to read hydro variables (e.g., density) from the fluid as well as kinetic plasma simulations.

To see some tests, click on "TestRun".

Please note, the MYTH code is neither connected with the yt community nor it wants to violate any copyright of the yt-project. The main intention of developing MYTH is to provide a simple user-friendly interface to compile yt-rendering. Users are strongly encouraged to include references for both the yt-project and MYTH if this code is used.


After successful installation, you may wish to run a test job. For installation guide, please download MYTH from the Download tab and then follow all steps in READ.md.

Test run can be performed as follows.

In MYTH/test/plutodata_neqg/, sample data files (data.0004.dbl,grid.out,stars.0004.txt) are provided. Data is in 3D cartesian coordinate, nx*ny*nz = 200*60*80.

Open terminal and go to the MYTH directory and then type

cd src

Look into user_input.py file. You will notice:

InputPath = "../test/plutodata_neqg/".

OutputPath = "../test/myth-pluto-neqg/".

It means, if you run MYTH then it will generate output at ../test/myth-pluto-neqg/. To run MYTH, use the following command on the terminal (note: your current directory is 'src'):

python myth.py

Please wait. It will take a while (for this test it may take ~ 2 min). After all steps, when you will see a Thank you message, you may look into your MYTH/test/myth-pluto-neqg/, which must contain the following files:

checkinput0004.png: z=0 slice of input data file

unigriddata0004.txt: Interpolated data with user's specified resolution.

checkdump0004.png: z=0 slice of interpolated data file

volren0004-transferfunction.png: Density transfer function. Note: label may not be correct.

volren0004.0001.png: Final output

Output will look as


You may download it from https://github.com/gupta-siddhartha/MYTH

or

by using the following command in your terminal (recommended):

git clone git@github.com:gupta-siddhartha/MYTH.git

Author of the MYTH code, Siddhartha Gupta, is a Postdoctoral Scholar working with Prof. Damiano Caprioli in the Department of Astronomy and Astrophysics at the University of Chicago. Click here to see his personal webpage. SG acknowledges the efforts of the yt community for providing such a wonderful visualization tool.

This code is written during a lockdown imposed almost everywhere in the World due the COVID19 pandemic. It is dedicated to all Doctors, Nurses, and all other people who are helping to fight against the COVID19 for a better tomorrow.